This analysis was done in June 2022.
Inclusion is fundamental to open government. In order for governments to be truly open, they must serve all people – including those who may have specific needs or lack political influence. The Open Government Partnership (OGP) has served as an important platform for reform in this area, including on gender equality through the Feminist Open Government initiative and the Break the Roles campaign. Since 2011, OGP members have made over 400 commitments related to the inclusion of historically underrepresented communities in open government efforts.
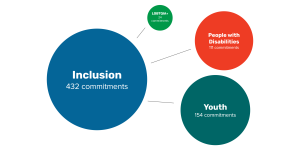
While inclusion commitments have addressed a range of underrepresented or vulnerable groups’ needs, certain groups have been more consistently addressed in commitments across regions. We at the OGP Support Unit recently conducted a retrospective analysis on all inclusion commitments made by national and local members in the last ten years to understand how many commitments have been made that explicitly reference three groups: people with disabilities, youth, and the LGBTQIA+ community. Commitments that address youth and people with disabilities make up a large portion of inclusion commitments, with one-third of inclusion commitments involving youth and one-quarter referencing people with disabilities (Figure 1). While there is strong representation of gender generally across inclusion commitments, a much smaller portion — only five percent — involve the LGBTQIA+ community. Here we look at these commitments by year, region, and level of government.
Commitments Over Time
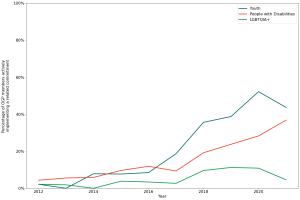
Commitments that address people with disabilities and youth have become more popular in recent years, while commitments involving the LGBTQIA+ community have remained low. The percentage of commitments that reference people with disabilities and the percentage that reference youth have both tripled in the last two years in comparison to the prior eight years. This encouraging amount of growth shows that OGP members are actively working to include the perspectives of these groups into commitments across a range of policy areas.
- Youth: Over 40 percent of OGP members today are currently implementing a youth-related commitment, compared to only two percent in 2012 (Figure 2). Many of these commitments focus on increasing youth participation in government decision-making and improving the quality of education systems.
- People with disabilities: One-third of OGP members currently have an active commitment focused on people with disabilities, compared to only five percent when OGP began. These commitments tend to focus on improving the accessibility of government language and services, along with opportunities for participation in government decision-making.
- LGBTQIA+: Five percent of OGP members are currently implementing LGBTQIA+ commitments, and while there was a slight increase in 2018, the numbers haven’t grown as significantly as the other areas. Most of these commitments involve the participation of LGBTQIA+ groups in policy-making across policy areas, while others focus on improved public service delivery.
Commitments by Region
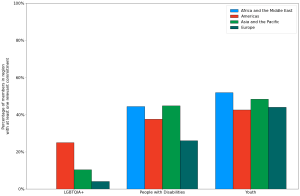
While commitment adoption in these three areas has varied by region, members in the Americas have shown the most consistent efforts to strengthen inclusion. Adoption of commitments related to youth and people with disabilities has been high in many regions, but members in the Americas have shown strong efforts to address all three areas of inclusion, especially LGBTQIA+ (Figure 3).
- Youth: Half of members in both Africa and the Middle East and Asia and the Pacific have made at least one commitment that references youth, while members in Europe and the Americas follow closely behind.
- People with disabilities: Over 40 percent of members in Africa and the Middle East and Asia and the Pacific have made at least one commitment that references people with disabilities. Europe, compared to other regions, has seen a lower level of commitment adoption in this area.
- LGBTQIA+: While few LGBTQIA+-focused commitments have been made overall, one-quarter of members in the Americas have made at least one commitment in this area. So far, no OGP members in Africa and the Middle East have made a commitment that mentions the LGBTQIA+ community.
Commitments by Level of Government
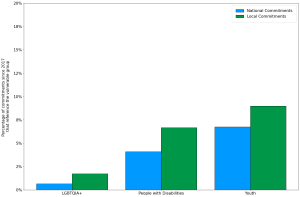
Local members tend to focus more on these areas of inclusion than national members. While both national and local members have shown dedication to inclusive reforms, a greater percentage of local commitments have focused on the inclusion of LGBTQIA+, people with disabilities, and youth in comparison to national commitments (Figure 4).
- Youth: Since the first local members joined OGP in 2017, nearly 10 percent of their commitments have involved youth, compared to six percent of national commitments in the same time frame.
- People with disabilities: A similar pattern is seen among commitments related to people with disabilities, which make up seven percent of all local commitments and only four percent of national commitments since 2017.
- LGBTQIA+: In comparison to commitments on youth or people with disabilities, few LGBTQIA+ commitments have been made by either national or local members. However, a slightly higher percentage of local commitments have included references to the LGBTQIA+ community in comparison to national commitments.
Additional Resources
For commitment examples or additional information on how to incorporate these areas of inclusion into your country or locality’s next action plan, check out the following resources:
- Actions for a More Inclusive Open Government Partnership recommends concrete actions that OGP members can take to make their action plan co-creation processes and commitments more inclusive.
- The Toolkit for More Gender-Responsive Action Plans contains guidance for strengthening the engagement of women, non-binary individuals, and LGBTQIA+ actors in OGP action plan co-creation processes.
- OGP’s gender and inclusion fact sheet provides an overview of global progress and commitment examples of open government work across areas of gender and inclusion.
- Part III of OGP’s Justice Policy Series includes a chapter on safeguarding the rights of people with disabilities.
- Let’s Put Some Pride into Open Government Action Plans features examples of how OGP members have engaged the LGBTQIA+ community through their co-creation processes and commitments.
- OGP’s Guide to Open Government and the Coronavirus discusses how governments can make pandemic recovery efforts more inclusive and address systemic barriers to equality.
- Commitment examples can be found on policy area pages for inclusion, gender, people with disabilities, youth, and LGBTQIA+.
- A forthcoming publication on youth commitments and recommendations by Accountability Lab will be linked here once available.
About the Data
All data from this analysis is available in open format in OGP’s public commitment database. Users can also explore this data further in an OGP commitment dashboard that will be published in the coming months. Any questions about how to use the data can be directed to [email protected].
